Has military pay kept up with inflation?
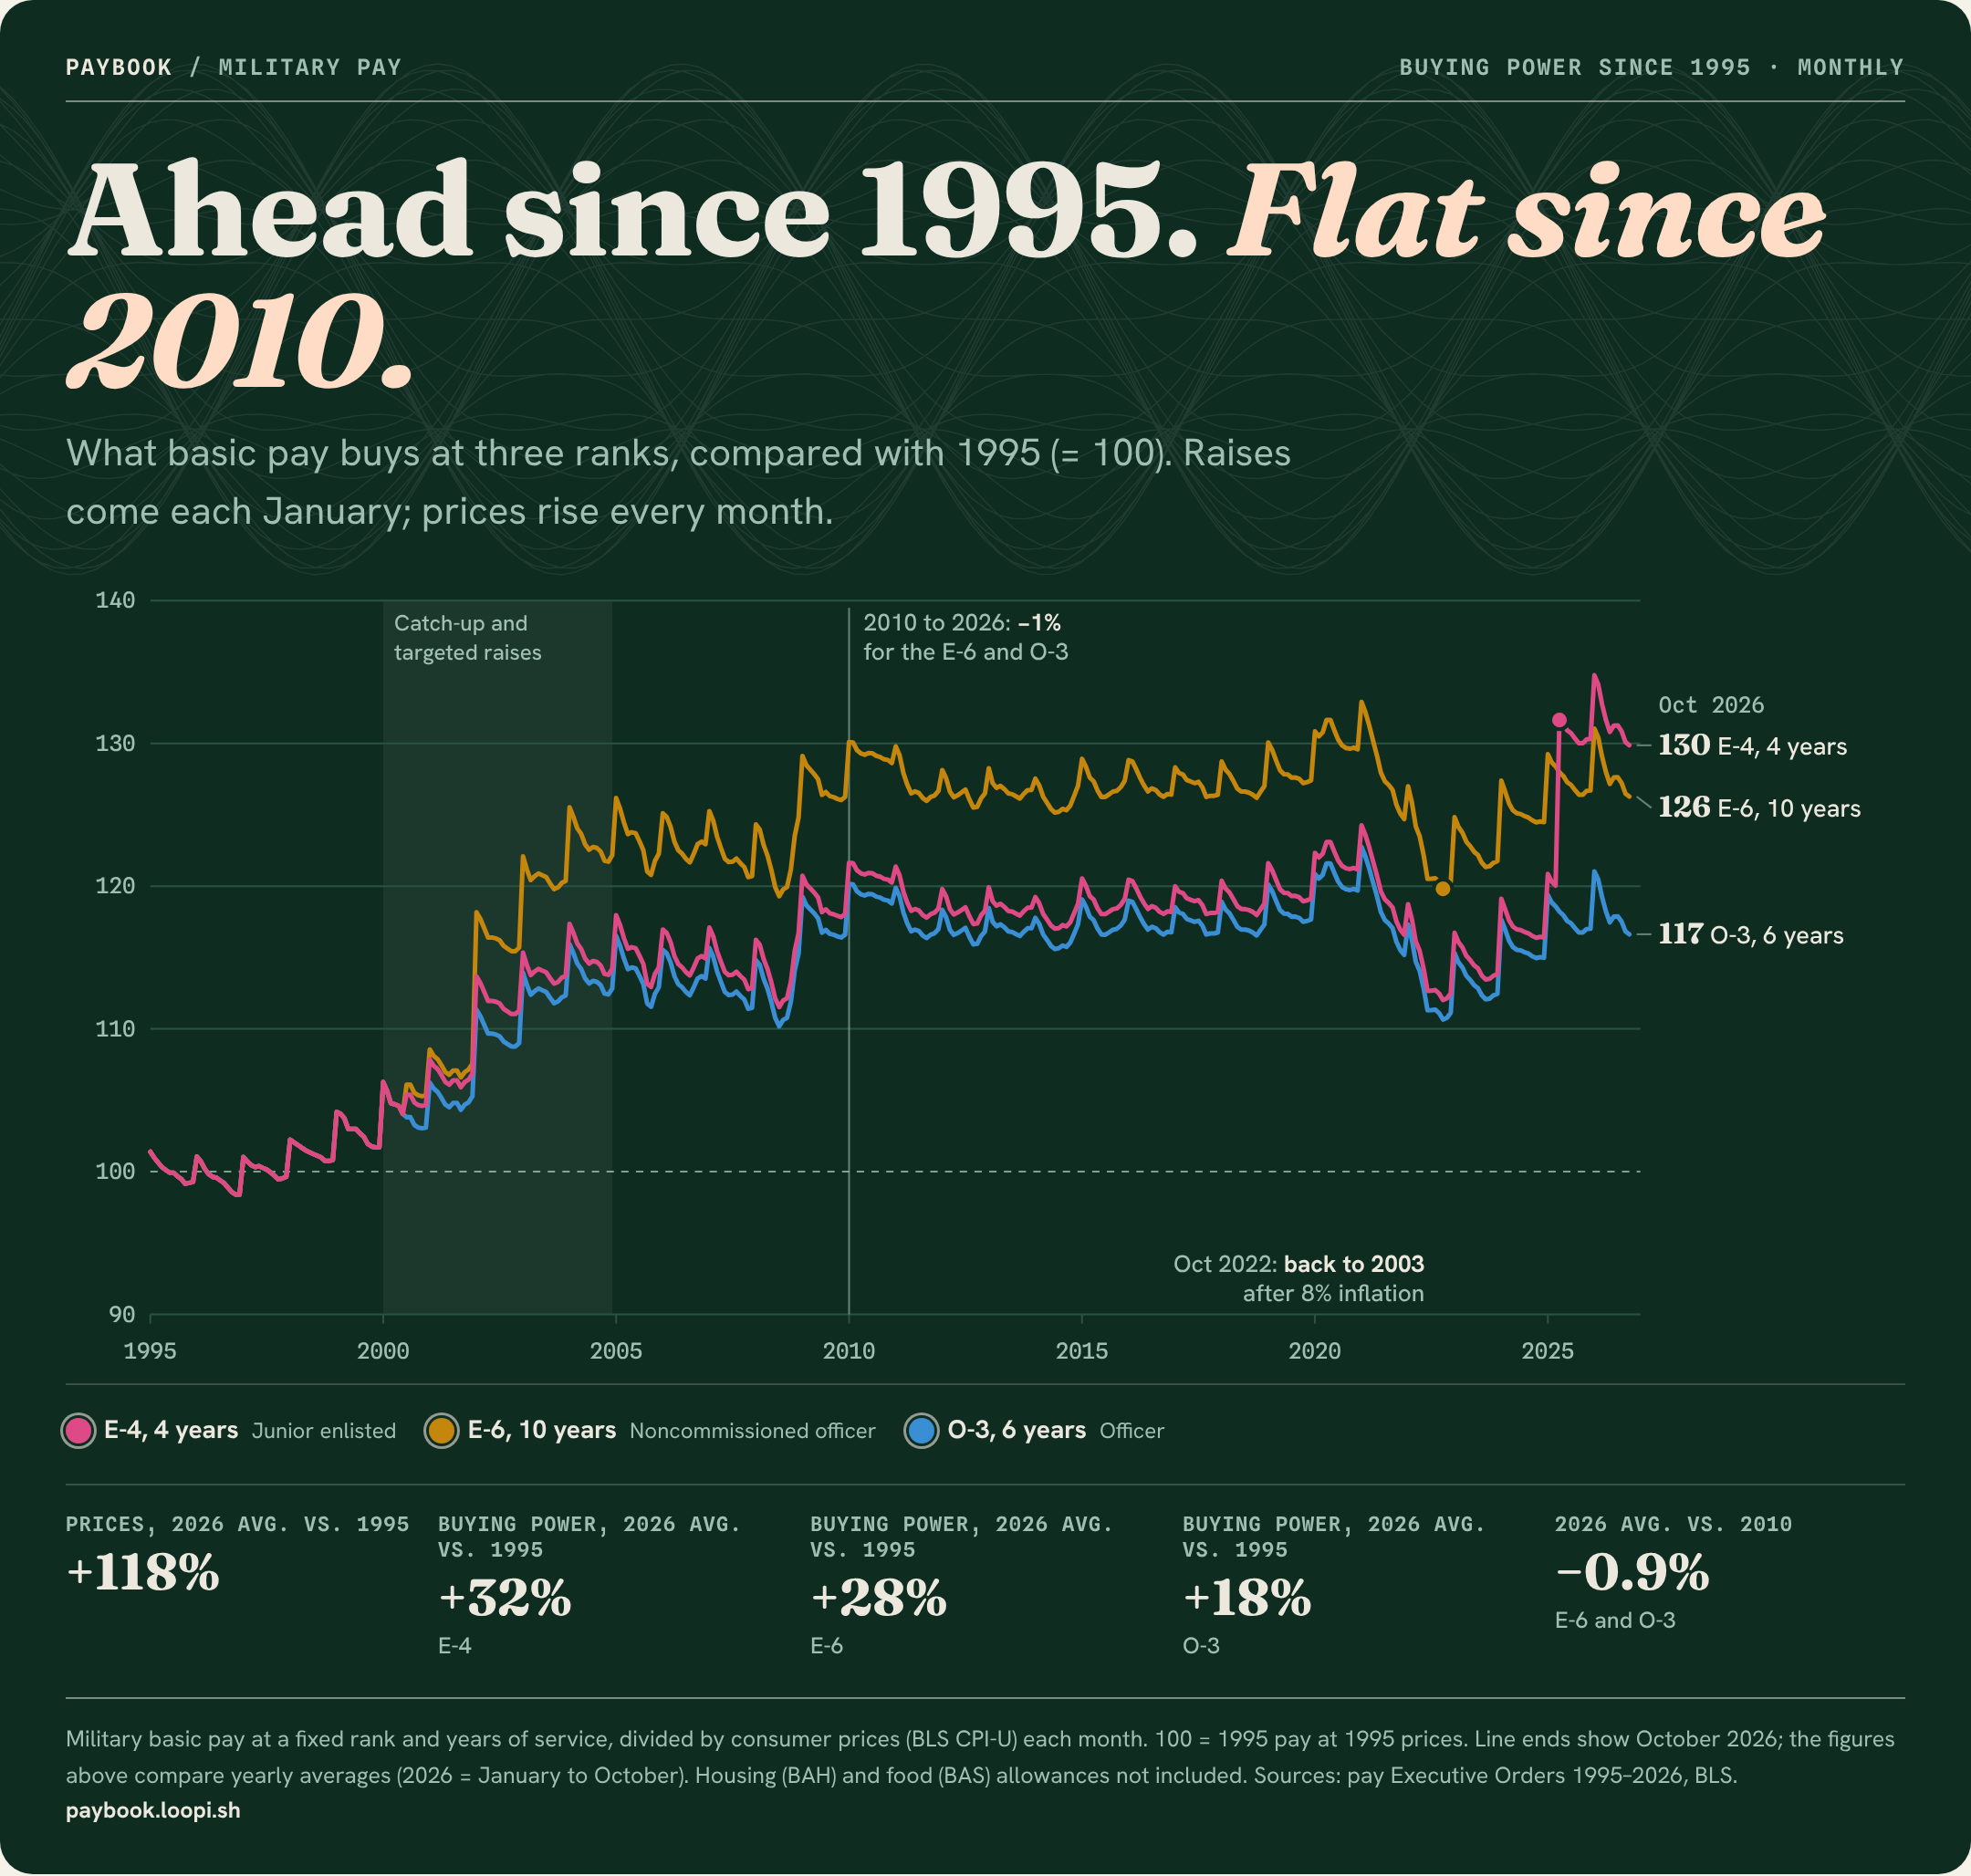
Over 30 years, yes. Since 1995, basic pay has beaten prices at every rank, by 16% to 32% depending on rank: 18% for a captain with 6 years, 32% for a junior enlisted member with 4. But nearly all of that gain came between 1999 and 2010. Since 2010, most ranks have been running in place, and the 2022 inflation spike knocked them back for three years. Pick a month you served below and see how your pay, and what it bought, compares with today.
Your pay, then and now
Loading the pay tables and prices…
Basic pay only: no housing (BAH) or food (BAS) allowance, special pays or taxes. Prices through October 2026.
Ahead since 1995. Flat since 2010.
What basic pay buys at three ranks, compared with 1995 (= 100). Raises come each January; prices rise every month.
- E-4, 4 yearsJunior enlisted
- E-6, 10 yearsNoncommissioned officer
- O-3, 6 yearsOfficer
- Prices, 2026 avg. vs. 1995
- +118%
- Buying power, 2026 avg. vs. 1995
- +32%E-4
- Buying power, 2026 avg. vs. 1995
- +28%E-6
- Buying power, 2026 avg. vs. 1995
- +18%O-3
- 2026 avg. vs. 2010
- −0.9%E-6 and O-3
Military basic pay at a fixed rank and years of service, divided by consumer prices (BLS CPI-U) each month. 100 = 1995 pay at 1995 prices. Line ends show October 2026; the figures above compare yearly averages (2026 = January to October). Housing (BAH) and food (BAS) allowances not included. Sources: pay Executive Orders 1995–2026, BLS. paybook.loopi.sh
- Over 30 years, every rank came out ahead. Prices have risen +118% since 1995. Basic pay rose more at every rank: after inflation, an E-4 with 4 years is up +32%, an E-6 with 10 years +28% and an O-3 with 6 years +18%.
- Nearly all of it came from 1999 to 2010. After recruiting troubles in the late 1990s, Congress set raises about half a point above the usual formula for a decade, rebuilt the pay table in July 2000 and gave larger targeted raises to mid-grade ranks in 2002 to 2004. By 2010 an E-6's pay bought +29% more than in 1995.
- Since 2010, most ranks are running in place. Raises were held to 1.0% in 2014 and 2015, below the formula, then the 2021–22 inflation spike hit. An E-6 or O-3 today buys −0.9% compared with the same rank in 2010. In October 2022, the low point, it was −8%.
- Junior enlisted are at their best point in 30 years. The extra 10% raise for E-1 to E-4 in April 2025 put an E-4's pay +9% ahead of 2010 and +32% ahead of 1995, after inflation.
- Since 2017: caught up, not paid back. Raises since 2017 add up to +36.8% and prices are up +35.8%. Pay fell 6% behind 2017 by October 2022 and caught up by 2025, but nothing repaid the years below: an E-6 with 10 years came up about $5,206 short of 2017's buying power in those months. Federal civilians (GS, outside the big-city pay areas) are still −8.6% behind 2017.
- Eggs, milk and coffee take less work time than in 1995; beef, gas and homes take more. An E-4 with 4 years worked 8 min for a dozen eggs in 1995 and 7 min in 2026. Ground beef went from 11 min to 19 min. Rent rose +183%, about as much as the E-4's pay (+188%); the median home rose +204%.
By law (37 U.S.C. 1009) each January raise matches private-sector wage growth, measured by the Employment Cost Index (ECI), over the year that ended in September more than a year earlier. So raises run behind prices: the 2022 raise was based on wages through September 2020, before prices took off. Congress can set a different number, and did: above the formula from 2000 to 2010, below it from 2014 to 2017.
| Year | Raise | Formula (wages) | Prices | E-4 | E-6 | O-3 |
|---|---|---|---|---|---|---|
| 1996 | 2.4% | – | 2.9% | 99 | 99 | 99 |
| 1997 | 3% | – | 2.3% | 100 | 100 | 100 |
| 1998 | 2.8% | – | 1.6% | 101 | 101 | 101 |
| 1999 | 3.6% | – | 2.2% | 103 | 103 | 103 |
| 2000 | 4.8%* | – | 3.4% | 105 | 105 | 104 |
| 2001 | 3.7% | – | 2.8% | 107 | 107 | 105 |
| 2002 | 6.9%* | – | 1.6% | 112 | 116 | 110 |
| 2003 | 4.7%* | – | 2.3% | 114 | 121 | 113 |
| 2004 | 4.15%* | 3.1% | 2.7% | 115 | 123 | 114 |
| 2005 | 3.5% | 2.9% | 3.4% | 115 | 123 | 114 |
| 2006 | 3.1% | 2.6% | 3.2% | 115 | 123 | 114 |
| 2007 | 2.2%* | 2.3% | 2.9% | 114 | 122 | 113 |
| 2008 | 3.5% | 3.1% | 3.8% | 114 | 122 | 113 |
| 2009 | 3.9% | 3.3% | -0.4% | 119 | 127 | 117 |
| 2010 | 3.4% | 2.9% | 1.6% | 121 | 129 | 119 |
| 2011 | 1.4% | 1.4% | 3.2% | 119 | 127 | 117 |
| 2012 | 1.6% | 1.6% | 2.1% | 118 | 126 | 117 |
| 2013 | 1.7% | 1.7% | 1.5% | 119 | 127 | 117 |
| 2014 | 1% | 1.8% | 1.6% | 118 | 126 | 116 |
| 2015 | 1% | 1.8% | 0.1% | 119 | 127 | 117 |
| 2016 | 1.3% | 2.3% | 1.3% | 119 | 127 | 117 |
| 2017 | 2.1% | 2.1% | 2.1% | 119 | 127 | 117 |
| 2018 | 2.4% | 2.4% | 2.4% | 119 | 127 | 117 |
| 2019 | 2.6% | 2.6% | 1.8% | 120 | 128 | 118 |
| 2020 | 3.1% | 3.1% | 1.2% | 122 | 130 | 120 |
| 2021 | 3% | 3% | 4.7% | 120 | 128 | 119 |
| 2022 | 2.7% | 2.7% | 8.0% | 114 | 122 | 113 |
| 2023 | 4.6% | 4.5% | 4.1% | 115 | 123 | 113 |
| 2024 | 5.2% | 5.3% | 2.9% | 117 | 125 | 116 |
| 2025 | 4.5%* | 4.5% | 2.6% | 128 | 128 | 118 |
| 2026 | 3.8% | 3.7% | 3.4%† | 132 | 128 | 118 |
* Plus a raise during the year, or a raise that varied by rank: July 2000 pay table reform; 2002, 2003 and 2004 targeted raises; April 2007 for warrant officers and senior enlisted; April 2025 for E-1 to E-4. The buying-power columns include them. † January to October. Formula: ECI wages and salaries, private industry, 12 months to September two years before (published from 2001).
Prices since then: +118%
| Rank | 1995 | 2026 | Change | After inflation |
|---|---|---|---|---|
| E-1 under 2 yrs | $854 | $2,407 | +182% | +29.0% |
| E-2 under 2 yrs | $958 | $2,698 | +182% | +29.0% |
| E-3 over 2 yrs | $1,050 | $3,015 | +187% | +31.5% |
| E-4 over 4 yrs | $1,272 | $3,659 | +188% | +31.7% |
| E-5 over 6 yrs | $1,437 | $4,110 | +186% | +31.0% |
| E-6 over 10 yrs | $1,702 | $4,760 | +180% | +28.1% |
| E-7 over 14 yrs | $2,062 | $5,835 | +183% | +29.6% |
| E-8 over 18 yrs | $2,443 | $6,811 | +179% | +27.7% |
| E-9 over 22 yrs | $3,005 | $8,423 | +180% | +28.3% |
| W-1 over 4 yrs | $1,814 | $4,859 | +168% | +22.6% |
| W-2 over 8 yrs | $2,171 | $6,051 | +179% | +27.6% |
| W-3 over 14 yrs | $2,692 | $7,398 | +175% | +25.9% |
| W-4 over 20 yrs | $3,376 | $9,229 | +173% | +25.2% |
| W-5 over 24 yrs | $4,013 | $11,070 | +176% | +26.3% |
| O-1 under 2 yrs | $1,636 | $4,150 | +154% | +16.1% |
| O-2 over 3 yrs | $2,473 | $6,272 | +154% | +16.2% |
| O-3 over 6 yrs | $2,995 | $7,737 | +158% | +18.3% |
| O-4 over 12 yrs | $3,625 | $9,888 | +173% | +24.9% |
| O-5 over 18 yrs | $4,560 | $11,714 | +157% | +17.6% |
| O-6 over 22 yrs | $5,495 | $14,113 | +157% | +17.6% |
Since 1995, officers gained less than enlisted members and warrant officers: the 2000–2004 targeted raises went mostly to mid-grade enlisted and warrant ranks. Officers with prior enlisted service (O-1E to O-3E) are in the tool above. General officers aren't shown: their pay is capped.
Full pay charts by year: 1995 · 1996 · 1997 · 1998 · 1999 · 2000 · 2001 · 2002 · 2003 · 2004 · 2005 · 2006 · 2007 · 2008 · 2009 · 2010 · 2011 · 2012 · 2013 · 2014 · 2015 · 2016 · 2017 · 2018 · 2019 · 2020 · 2021 · 2022 · 2023 · 2024 · 2025 · 2026
| Item | 1995 | 2026 | Work time, 1995 | Work time, 2026 |
|---|---|---|---|---|
| A pound of ground beef | $1.37 | $6.80 | 11 min | 19 min |
| A gallon of gas | $1.15 | $4.02 | 9 min | 11 min |
| A dozen eggs | $0.92 | $2.31 | 8 min | 7 min |
| A pound of coffee | $4.04 | $9.43 | 33 min | 27 min |
| A pound of bread | $0.79 | $1.83 | 6 min | 5 min |
| A pound of chicken | $0.92 | $2.03 | 7 min | 6 min |
| 1,000 kWh of electricity | $94 | $194 | 12 hr 45 min | 9 hr 11 min |
| A gallon of milk | $2.48 | $4.16 | 20 min | 12 min |
| A pound of bananas | $0.49 | $0.65 | 4 min | 2 min |
| Year | All prices | Rent | Eggs, dozen | Ground beef, lb | Gas, gallon | Median home | E-4 pay |
|---|---|---|---|---|---|---|---|
| 1995 | 100 | 100 | $0.92 | $1.37 | $1.15 | $133,475 | $1,272 |
| 1996 | 103 | 103 | $1.11 | $1.37 | $1.23 | $140,250 | $1,302 |
| 1997 | 105 | 106 | $1.06 | $1.40 | $1.23 | $145,000 | $1,342 |
| 1998 | 107 | 109 | $1.04 | $1.41 | $1.06 | $151,925 | $1,379 |
| 1999 | 109 | 112 | $0.96 | $1.45 | $1.17 | $160,125 | $1,429 |
| 2000 | 113 | 117 | $0.91 | $1.57 | $1.51 | $167,550 | $1,509 |
| 2001 | 116 | 122 | $0.93 | $1.71 | $1.46 | $173,100 | $1,576 |
| 2002 | 118 | 127 | $1.03 | $1.71 | $1.36 | $186,025 | $1,680 |
| 2003 | 121 | 130 | $1.24 | $1.95 | $1.59 | $192,125 | $1,749 |
| 2004 | 124 | 134 | $1.34 | $2.16 | $1.88 | $218,150 | $1,814 |
| 2005 | 128 | 138 | $1.22 | $2.30 | $2.30 | $236,550 | $1,878 |
| 2006 | 132 | 143 | $1.31 | $2.22 | $2.59 | $243,750 | $1,936 |
| 2007 | 136 | 149 | $1.68 | $2.30 | $2.80 | $244,950 | $1,979 |
| 2008 | 141 | 154 | $1.99 | $2.34 | $3.27 | $229,550 | $2,048 |
| 2009 | 141 | 158 | $1.66 | $2.22 | $2.35 | $215,650 | $2,128 |
| 2010 | 143 | 158 | $1.66 | $2.37 | $2.79 | $222,700 | $2,200 |
| 2011 | 148 | 161 | $1.77 | $2.77 | $3.53 | $224,900 | $2,231 |
| 2012 | 151 | 165 | $1.84 | $3.03 | $3.64 | $244,400 | $2,267 |
| 2013 | 153 | 170 | $1.91 | $3.40 | $3.53 | $266,225 | $2,305 |
| 2014 | 155 | 175 | $2.02 | $3.90 | $3.37 | $285,775 | $2,328 |
| 2015 | 156 | 181 | $2.47 | $4.17 | $2.45 | $294,150 | $2,351 |
| 2016 | 158 | 188 | $1.68 | $3.75 | $2.14 | $305,125 | $2,382 |
| 2017 | 161 | 195 | $1.47 | $3.64 | $2.41 | $322,425 | $2,432 |
| 2018 | 165 | 202 | $1.74 | $3.72 | $2.74 | $325,275 | $2,490 |
| 2019 | 168 | 210 | $1.40 | $3.81 | $2.64 | $320,250 | $2,555 |
| 2020 | 170 | 216 | $1.51 | $4.12 | $2.17 | $328,150 | $2,634 |
| 2021 | 178 | 221 | $1.67 | $4.33 | $3.05 | $383,000 | $2,713 |
| 2022 | 192 | 235 | $2.86 | $4.81 | $4.09 | $432,950 | $2,787 |
| 2023 | 200 | 253 | $2.80 | $5.02 | $3.66 | $426,525 | $2,915 |
| 2024 | 206 | 266 | $3.17 | $5.39 | $3.45 | $418,975 | $3,066 |
| 2025 | 211 | 276 | $4.25 | $6.09 | $3.26 | $415,400 | $3,445 |
| 2026† | 218 | 283 | $2.31 | $6.80 | $4.02 | $405,100 | $3,659 |
† January to October 2026. Rent and all prices are BLS indexes (1995 = 100), not dollar amounts.
- Military basic pay, every table since 1995: the pay Executive Order for each year, Schedule 8 (Federal Register, via GovInfo). The orders from before 2015 are scanned pages, so the 2000, 2001, 2002, 2003, 2004 and January 2007 tables were read with OCR and checked cell by cell (every correction is listed in
data/history/payorder-ocr.json). Years when every cell got the same raise are computed from the next year's table and checked against the printed tables, to within $1 a month. Mid-year raises in July 2000, April 2007 and April 2025 are included. Not included: a July 2001 raise for some E-5 to E-7 ranks (the January 2001 table is used all year), and general officers, whose pay is capped. - Prices: BLS Consumer Price Index (CPI-U), U.S. city average, not seasonally adjusted, for all prices, rent, groceries and cars; BLS average prices for eggs, milk, bread, ground beef, chicken, bananas, coffee, gas and electricity; Census median sales price of houses sold (quarterly). All read through FRED. BLS published no October 2025 numbers (the shutdown); the nearest month is used.
- Wage formula: Employment Cost Index, wages and salaries, private industry, 12-month change to the third quarter (current, revised values).
- Buying power: pay divided by prices. Work time: basic pay a month divided by 173 hours (a 40-hour week). Service members work more hours than that, so it's a yardstick, not a timesheet.
- GS comparison (since 2017): General Schedule base pay and Rest of U.S. locality rates from the same orders.
- Not included: housing allowance (BAH), which follows local rents; food allowance (BAS); special pays, bonuses and taxes. National average prices may not match your area.
Use the chart anywhere, with a link back to this page. Download the image
Free to use, including commercially, under CC BY 4.0: credit Paybook and link to this page. Questions or need the data? Email paybook@loopi.sh.
Data: every military pay table since 1995 (CSV)
Free to use, including commercially, under CC BY 4.0: credit Paybook and link to this page. Questions or corrections: paybook@loopi.sh.
Military pay chart · Retirement calculator · Retirement in divorce · The 2027 raise · Your pay today · More stories