Why are so many of America's top federal jobs in Washington?
GS-15 is the highest grade in the federal government's main pay system. The Washington, DC area has 17% of that system's employees whose work locations are publicly reported, but 58% of its GS-15s.
The federal government uses a system called the General Schedule, or GS, to classify many of its jobs. It runs from GS-1 to GS-15. Higher grades generally mean greater responsibility and higher pay: in 2026, a GS-15 earns $147,945 to $197,200 a year. GS-14 and GS-15 are the two highest grades in that system, below the separate executive ranks.
Washington (here, the DC metro area, including its Maryland and Virginia suburbs) has a lot of government headquarters, so you might expect it to have more senior jobs.
But the difference is enormous. And it doesn't disappear when we compare employees doing similar kinds of work, or even employees in the same occupation at the same agency. In 147 of the 171 agency-and-occupation groups we examined, Washington still has the higher share of GS-14 and GS-15 employees.
We analyzed records from the Office of Personnel Management for 734,583 General Schedule employees whose work locations are public, to understand where the highest-grade jobs are concentrated, and what might explain it.
17%of GS employees work in the Washington, DC area
58%of GS-15s, the highest grade, work there
Explore your cityor keep reading to see what we tested
Same occupation. Very different grades.
Consider people who work in federal human resources.
In the Washington area, 40% hold GS-14 or GS-15 grades.
Outside Washington, just 11% do.
And human resources isn't an isolated example.
| Federal occupation | Washington area at GS-14+ | Everywhere else |
|---|---|---|
| Human resources | 40% | 11% |
| Budget analysis | 50% | 13% |
| IT management | 55% | 25% |
| Contracting | 52% | 22% |
Across 42 large occupations with senior-grade positions, 41 have a higher share of GS-14+ employees in the Washington area.
These are occupational categories, not necessarily identical positions. A budget analyst working on a nationwide program may have very different responsibilities from one supporting a local office.
But that distinction raises the next question.
What explains such a consistent difference?
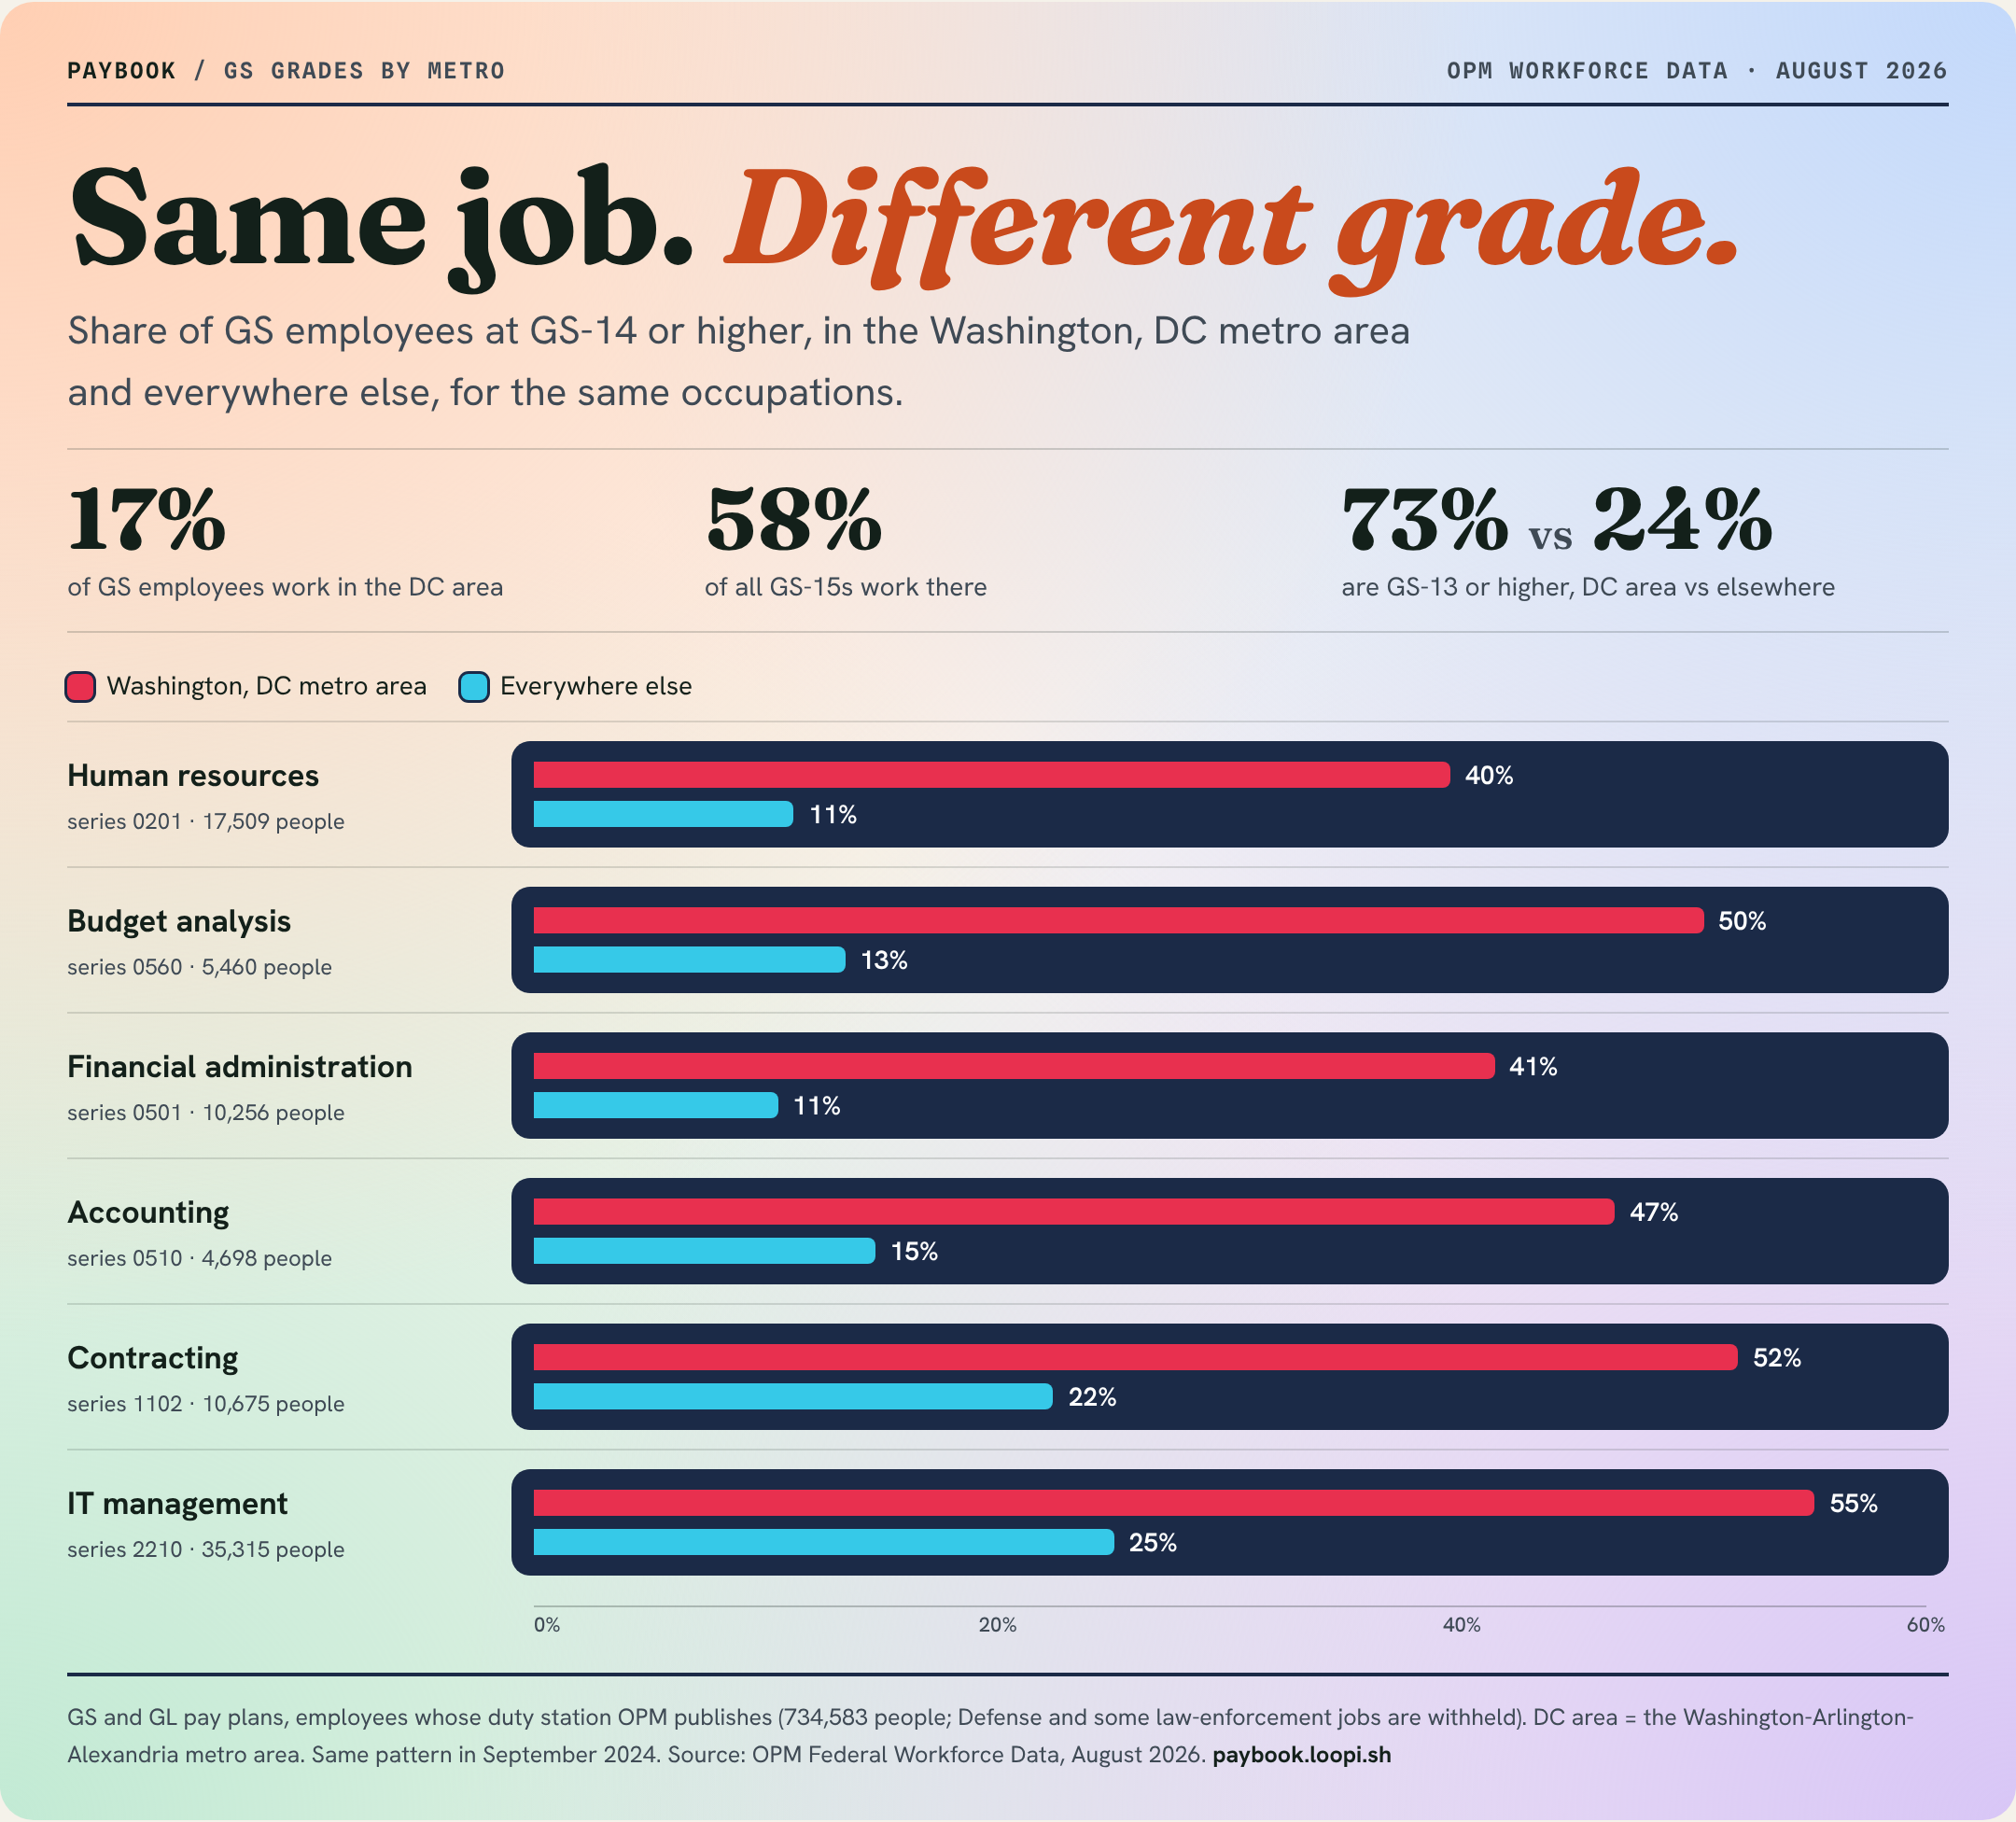
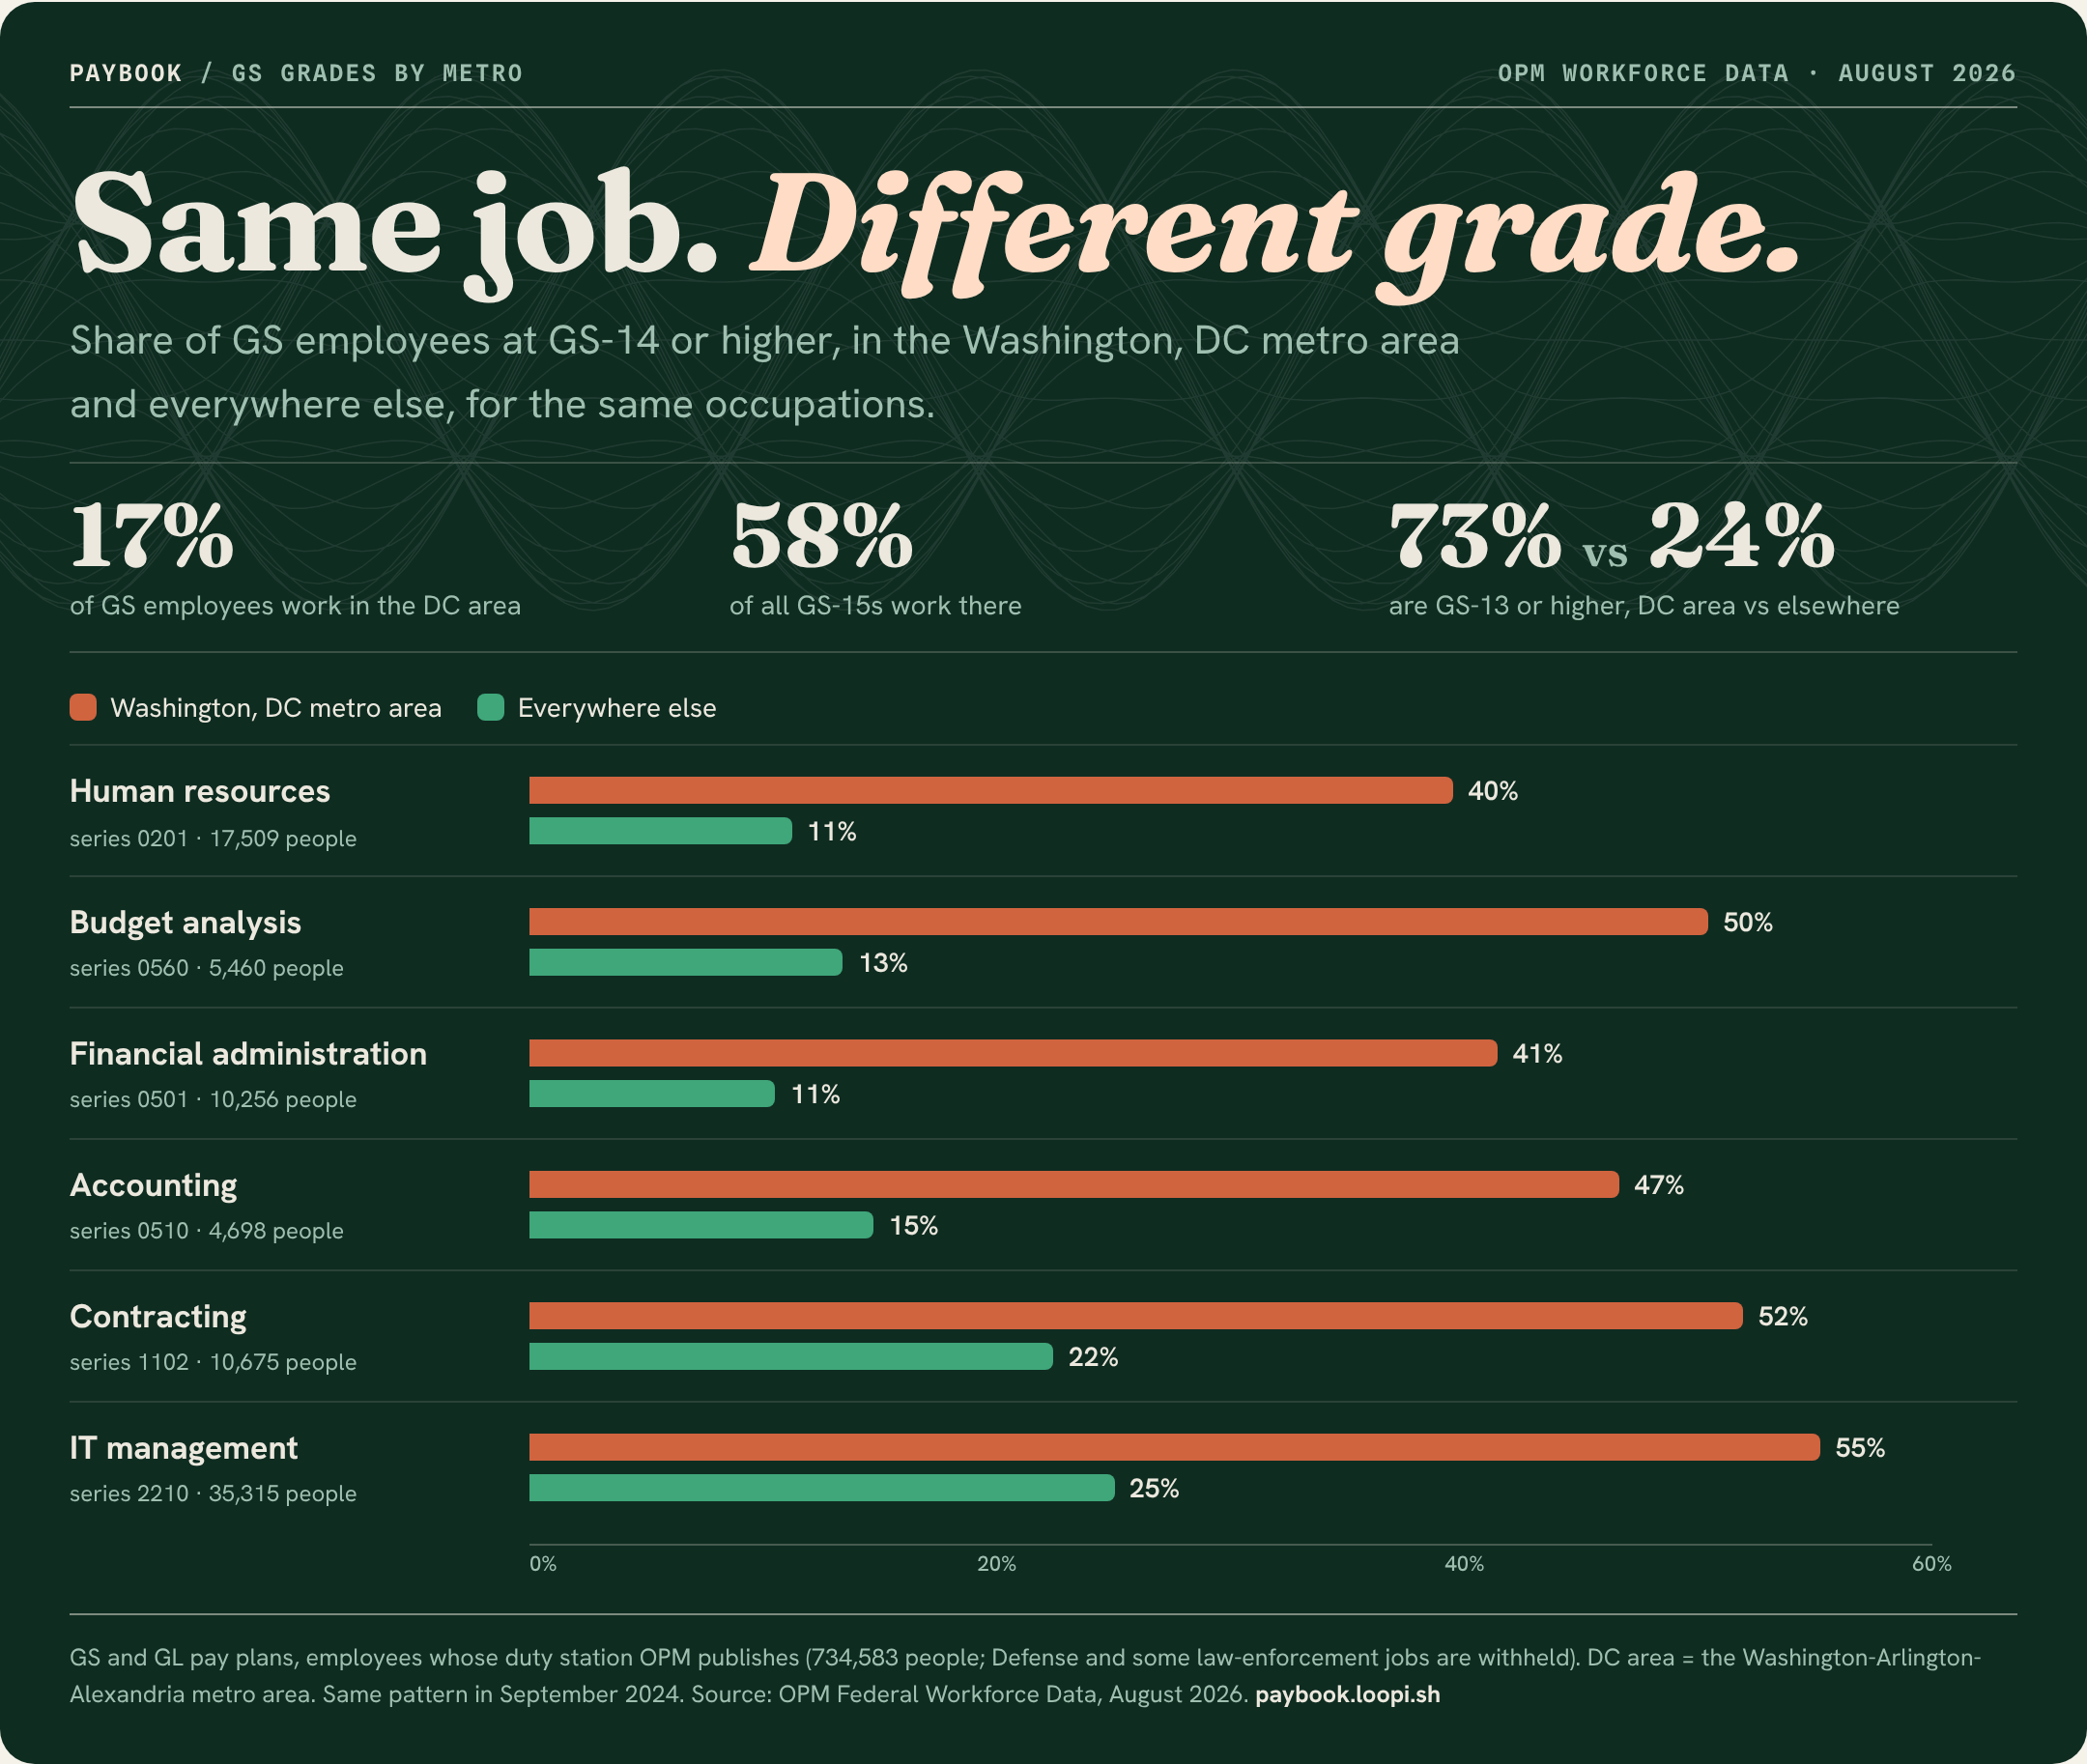
Same job. Different grade.
Share of GS employees at GS-14 or higher, in the Washington, DC metro area and everywhere else, for the same occupations.
17%of GS employees work in the DC area
58%of all GS-15s work there
73% vs 24%are GS-13 or higher, DC area vs elsewhere
- Washington, DC metro area
- Everywhere else
Human resourcesseries 0201 · 17,509 people
Budget analysisseries 0560 · 5,460 people
Financial administrationseries 0501 · 10,256 people
Accountingseries 0510 · 4,698 people
Contractingseries 1102 · 10,675 people
IT managementseries 2210 · 35,315 people
GS and GL pay plans, employees whose duty station OPM publishes (734,583 people; Defense and some law-enforcement jobs are withheld). DC area = the Washington-Arlington-Alexandria metro area. Same pattern in September 2024. Source: OPM Federal Workforce Data, August 2026. paybook.loopi.sh
We tested the explanations you'd probably think of first
Maybe Washington has more experienced employees. Maybe they're more educated. Maybe more of them manage other people. Or perhaps the entire difference comes from the kinds of jobs and agencies concentrated in the capital.
OPM's employee data lets us investigate those possibilities. Each comparison below uses the same occupations in both places, weighted to Washington's mix of jobs.
Are Washington employees more experienced?
Not dramatically, by this measure. Their median federal service is 15.2 years, compared with 14.7 years elsewhere.
Are they more educated?
The difference is modest. About 70% of employees in the Washington comparison have at least a bachelor's degree, compared with 67% elsewhere.
Are more of them supervisors?
Somewhat. About 20% supervise or lead others in Washington, versus 16% elsewhere.
But even among employees who don't, the GS-14+ share is 37% in Washington versus 18% elsewhere.
Does Washington simply have different occupations?
That's part of the story, but not all of it. When we compare the same occupational categories and weight them to Washington's mix of jobs, 47% of Washington employees are GS-14+, compared with 24% elsewhere.
What if we compare the same agency and occupation?
The difference gets smaller, but it remains substantial. Across comparable agency-and-occupation groups (each with at least 100 employees in both places), the GS-14+ shares are 49% in Washington versus 33% elsewhere. Washington has the higher share in 147 of 171 groups examined.
These comparisons don't control for every difference between individual positions. But they show that the pattern goes beyond a simple difference in occupations, education, experience or supervisory status.
The geography of senior federal jobs is harder to explain away than it first appears.
What might explain the remaining difference?
One important possibility is the way federal positions are designed and classified.
Government grades are assigned to positions based on factors such as responsibility, complexity and scope, not simply the qualifications of the person holding the job.
A human resources specialist developing policy for an entire federal agency may occupy a higher-graded position than someone administering HR services in a regional office. Both can belong to the same occupational series. Their responsibilities may be very different.
And many positions with national responsibilities are based in or near Washington. That helps explain why headquarters matter.
But our data cannot establish how much of the remaining difference is justified by those responsibilities, or whether the system is fair.
What it establishes is that senior federal grades are distributed very unevenly, and the difference remains visible through several increasingly specific comparisons.
What about the rest of America?
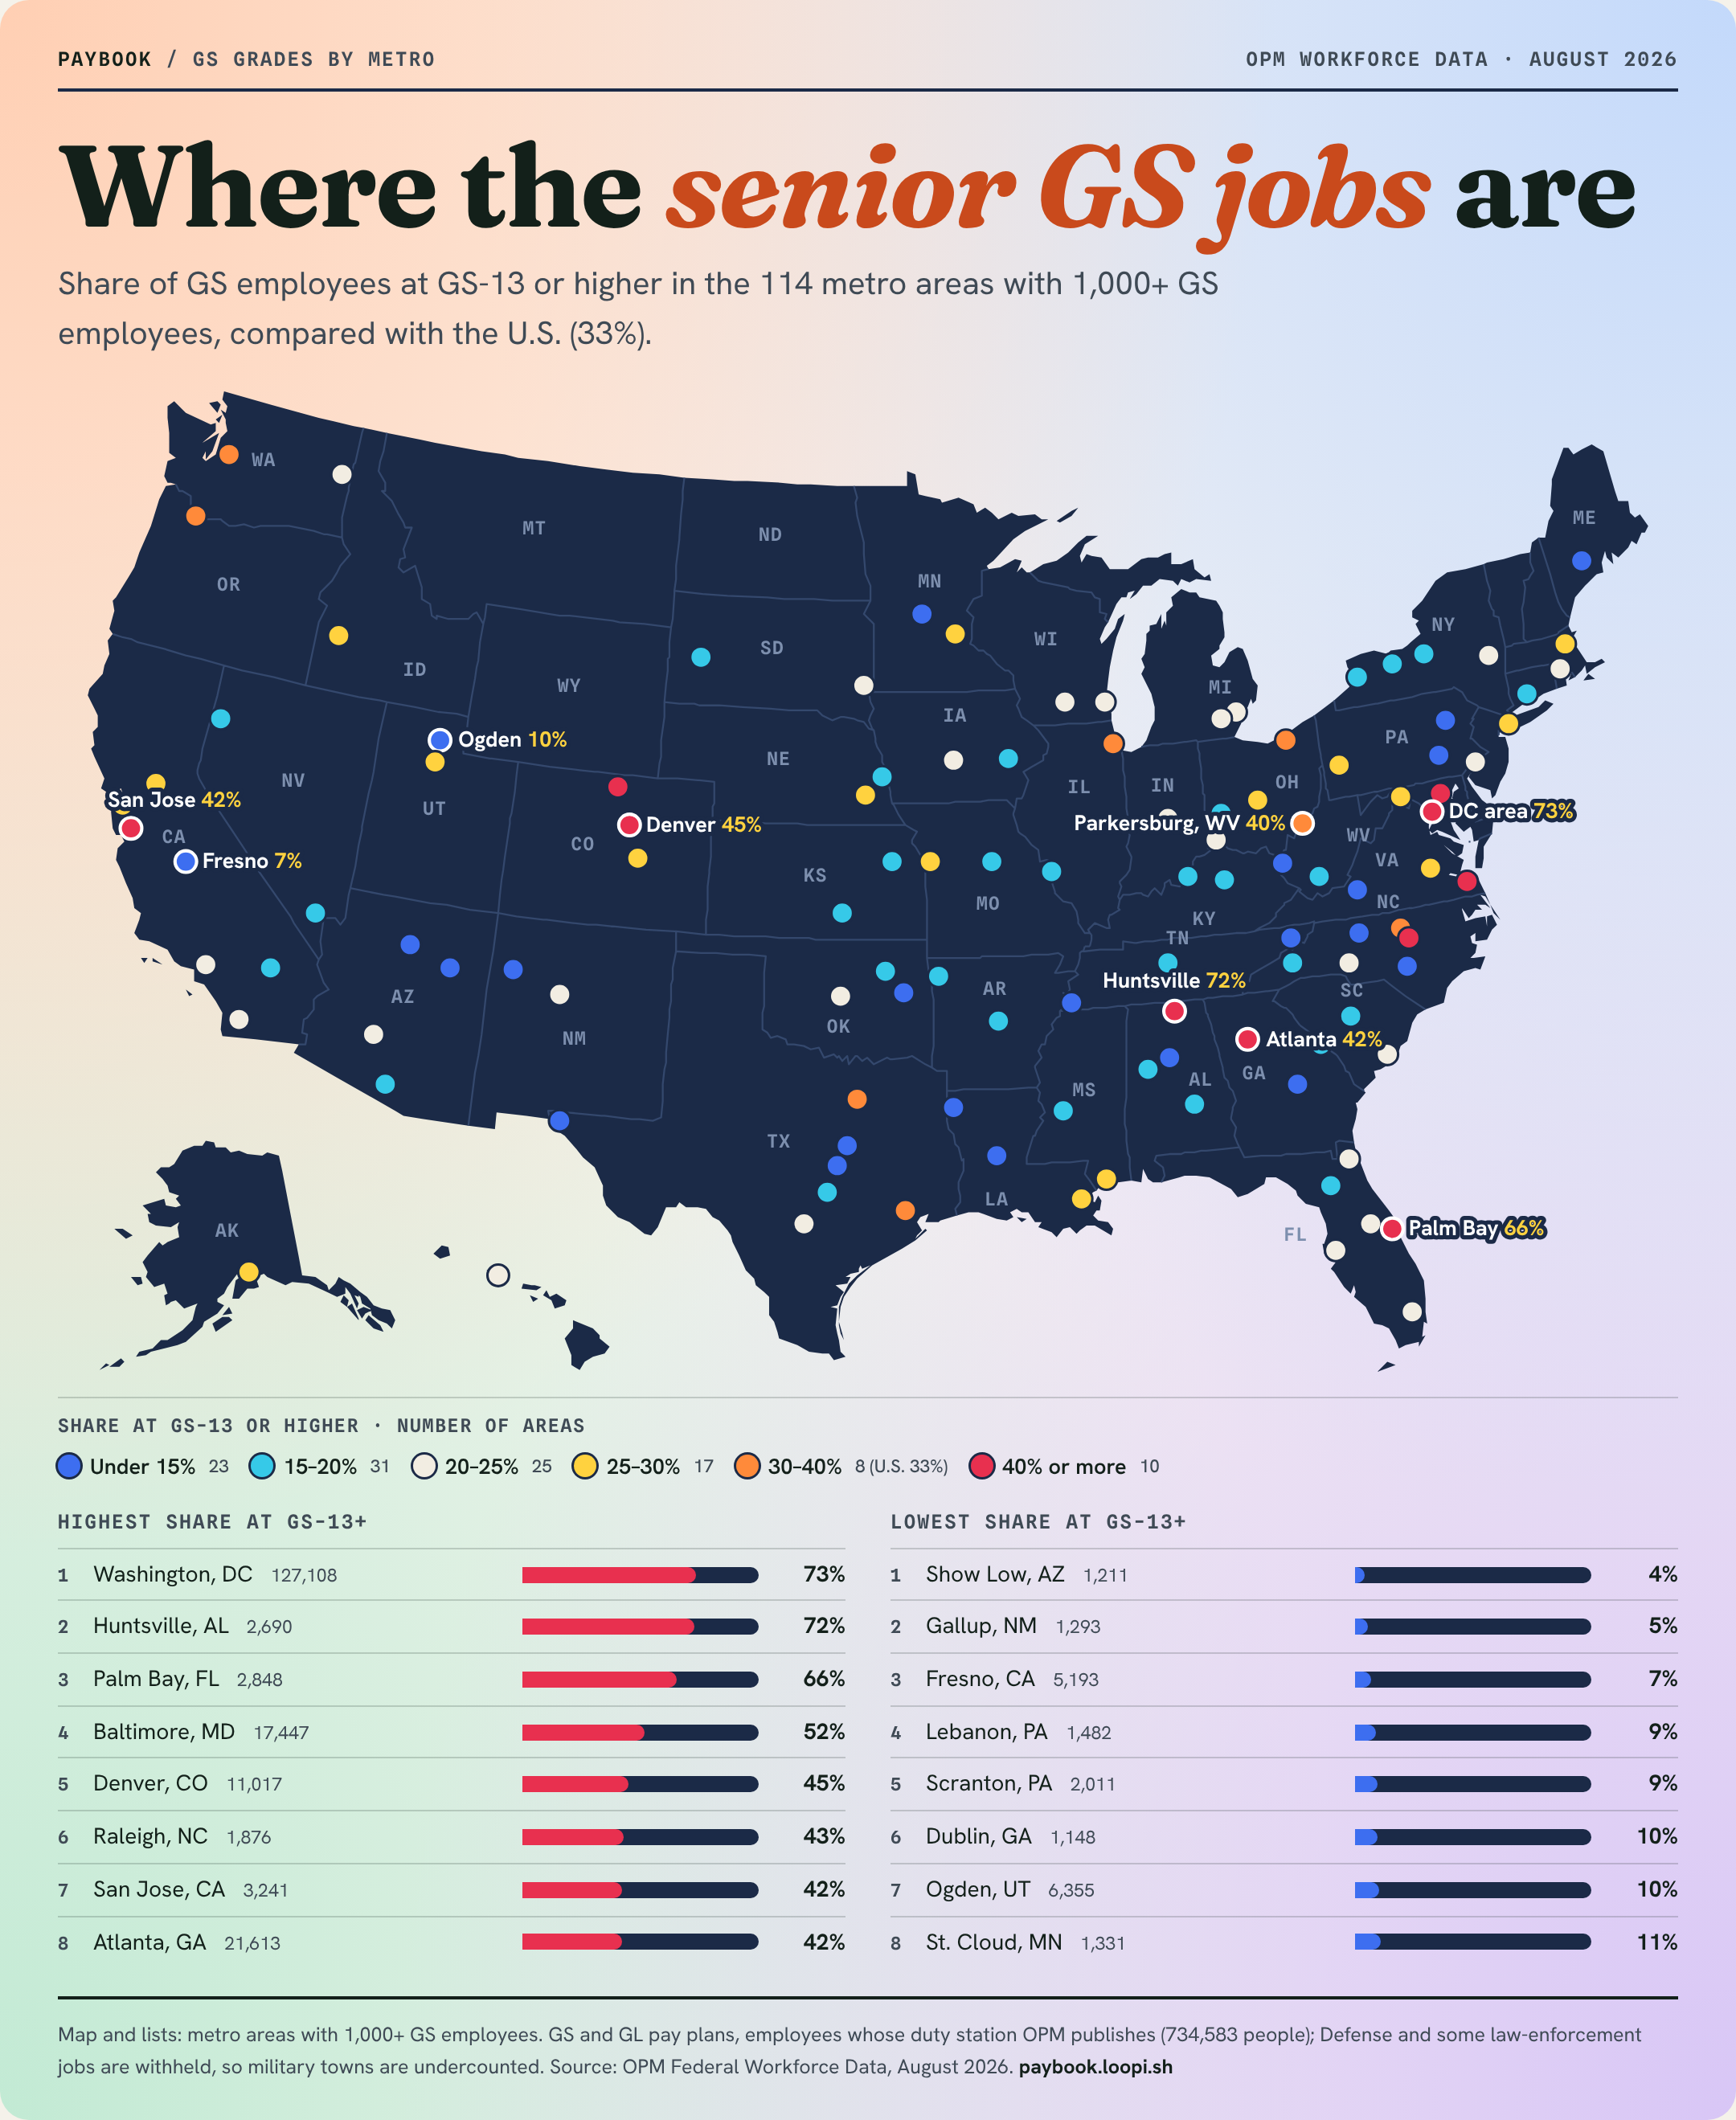
Washington isn't the only interesting place. Among employees whose work locations are published, the share at GS-13 or higher (the top three grades; 32.8% nationally) is:
- Huntsville, Alabama: 72.5%
- Palm Bay–Melbourne, Florida: 65.6%
- Baltimore, Maryland: 51.8%
- Denver, Colorado: 44.9%
- Chicago, Illinois: 30.3%
- New York metro: 26.3%
Those numbers reflect very different mixes of agencies and occupations. They are not measures of how likely an individual employee is to receive a promotion. And they're incomplete pictures of some regions, especially those with substantial Defense or law-enforcement workforces.
Still, they reveal just how different the federal workforce can look from one community to another.
What does it look like where you work, or where you're thinking of moving?
Where the senior GS jobs are
Share of GS employees at GS-13 or higher in the 114 metro areas with 1,000+ GS employees, compared with the U.S. (33%).
Share at GS-13 or higher · number of areas
- Under 15% 23
- 15–20% 31
- 20–25% 25
- 25–30% 17
- 30–40% 8 (U.S. 33%)
- 40% or more 10
Highest share at GS-13+
- Washington, DC127,10873%
- Huntsville, AL2,69072%
- Palm Bay, FL2,84866%
- Baltimore, MD17,44752%
- Denver, CO11,01745%
- Raleigh, NC1,87643%
- San Jose, CA3,24142%
- Atlanta, GA21,61342%
Lowest share at GS-13+
- Show Low, AZ1,2114%
- Gallup, NM1,2935%
- Fresno, CA5,1937%
- Lebanon, PA1,4829%
- Scranton, PA2,0119%
- Dublin, GA1,14810%
- Ogden, UT6,35510%
- St. Cloud, MN1,33111%
Map and lists: metro areas with 1,000+ GS employees. GS and GL pay plans, employees whose duty station OPM publishes (734,583 people); Defense and some law-enforcement jobs are withheld, so military towns are undercounted. Source: OPM Federal Workforce Data, August 2026. paybook.loopi.sh
Compare any two places
Search your metro area or state. Compare two locations. Choose your occupation. See the actual grade distribution, the number of employees represented, and how your area compares with the published national workforce.
Try:
Loading 1008 places…
- GS-1–4
- GS-5–9
- GS-10–12
- GS-13
- GS-14
- GS-15
The same jobs in both places
The largest occupations with 20+ published employees in both. Pick one to compare it in full.
| Occupation | Gap |
|---|
| # | Area | Employees | GS-13+ | GS-14+ |
|---|
What this research can, and cannot, tell us
This is a snapshot of people currently employed, not job openings, promotions or individual career outcomes.
It also doesn't represent the entire federal government. OPM withholds duty-station locations for approximately 44% of GS employees, including Defense employees and many law-enforcement occupations. Our geographic findings therefore apply to employees whose locations are publicly reported.
We used OPM's August 2026 employment snapshot and checked major findings against September 2024 data. The concentration of senior grades around Washington was similar in both periods (58% of GS-15s then).
The analysis includes downloadable metro, state and occupation data, along with definitions, calculations, sources and limitations. You can reuse the original graphics and analysis with attribution under CC BY 4.0.
The question isn't whether Washington has more senior federal positions. It clearly does.
The more interesting question is why the differences remain so large, even among employees in the same occupations and agencies.
And what that means for people building federal careers outside the capital.
It isn't only Washington vs everywhere else
Every city has its own mix of headquarters, regional offices and local service centers, so the order changes with the job. In Dallas, IT specialists come closer to Washington than Baltimore's do, but HR specialists there are among the least likely to reach GS-14.
| Metro area | HR 0201 | IT 2210 | Contracting 1102 | Program analysis 0343 |
|---|---|---|---|---|
| DC area | 40% | 55% | 52% | 41% |
| Baltimore, MD | 24% | 29% | 35% | 28% |
| Denver, CO | 20% | 33% | 28% | 23% |
| Philadelphia, PA | 18% | 25% | 29% | 24% |
| Kansas City, MO | 17% | 24% | 26% | 25% |
| Atlanta, GA | 13% | 34% | 32% | 21% |
| Chicago, IL | 14% | 20% | 22% | 21% |
| Dallas, TX | 11% | 40% | 24% | 24% |
| Austin, TX | 12% | 30% | – | 27% |
| Houston, TX | 12% | 23% | 24% | 36% |
| New York, NY | 13% | 29% | 26% | 24% |
| San Francisco, CA | 14% | 29% | – | 21% |
| U.S. | 17% | 37% | 30% | 31% |
Pay follows the same pattern, but local prices even it out more than you might expect. The typical HR specialist earns $149k in the DC area and $115k in Kansas City. Adjusted for local prices, that's $137k vs $125k. In Houston it's $129k, about the same as in Baltimore ($128k).
Same occupation, Washington area vs everywhere else
Share at GS-14 or higher in each large occupation. The one exception is paralegal specialist, a job whose locations OPM only partly publishes.
| Occupation | DC area | Elsewhere | Gap | September 2024 |
|---|---|---|---|---|
| Management And Program Analysis 0343 | 41.4% | 22.1% | +19.3 | 41% / 23% |
| Information Technology Management 2210 | 55.2% | 25.0% | +30.2 | 55% / 25% |
| Miscellaneous Administration And Program 0301 | 40.3% | 15.2% | +25.1 | 40% / 17% |
| General Attorney 0905 | 90.0% | 65.4% | +24.6 | 88% / 61% |
| Patent Examining 1224 | 61.0% | 56.6% | +4.4 | 73% / 53% |
| Human Resources Management 0201 | 39.5% | 11.2% | +28.3 | 40% / 11% |
| General Health Science 0601 | 77.9% | 18.2% | +59.7 | 74% / 19% |
| Contracting 1102 | 51.9% | 22.4% | +29.5 | 50% / 22% |
| General Business And Industry 1101 | 51.8% | 14.1% | +37.7 | 52% / 14% |
| Security Administration 0080 | 27.8% | 11.7% | +16.1 | 27% / 13% |
| General Natural Resources Management And Biological Sciences 0401 | 31.3% | 12.2% | +19.1 | 31% / 12% |
| Budget Analysis 0560 | 50.4% | 13.4% | +37.0 | 48% / 13% |
| Financial Administration And Program 0501 | 41.4% | 10.5% | +30.9 | 42% / 12% |
| Program Management 0340 | 91.9% | 72.5% | +19.4 | 92% / 75% |
| Social Science 0101 | 32.0% | 5.9% | +26.1 | 33% / 7% |
| Economist 0110 | 54.6% | 28.0% | +26.6 | 54% / 27% |
| Accounting 0510 | 46.6% | 14.7% | +31.9 | 45% / 16% |
| Statistics 1530 | 35.0% | 20.8% | +14.2 | 35% / 21% |
| General Engineering 0801 | 73.4% | 48.1% | +25.3 | 70% / 51% |
| Administrative Officer 0341 | 37.6% | 4.3% | +33.3 | 36% / 5% |
| Grants Management 1109 | 34.0% | 15.8% | +18.2 | 34% / 12% |
| Miscellaneous Clerk And Assistant 0303 | 0.0% | 0.0% | 0.0 | 0% / 0% |
| General Arts And Information 1001 | 23.4% | 20.3% | +3.1 | 26% / 18% |
| Public Health Program Specialist 0685 | 39.9% | 32.4% | +7.5 | 40% / 30% |
| Nurse 0610 | 8.3% | 1.1% | +7.2 | 10% / 1% |
| Auditing 0511 | 36.4% | 26.6% | +9.8 | 38% / 26% |
| General Physical Science 1301 | 56.9% | 28.4% | +28.5 | 59% / 29% |
| Paralegal Specialist 0950 | 2.3% | 5.2% | −2.9 | 2% / 5% |
| Public Affairs 1035 | 46.9% | 15.3% | +31.6 | 49% / 18% |
| Emergency Management Specialist 0089 | 44.3% | 21.8% | +22.5 | 43% / 22% |
| Government Information Specialist 0306 | 32.0% | 13.7% | +18.3 | 31% / 14% |
| Environmental Protection Specialist 0028 | 47.3% | 17.3% | +30.0 | 52% / 18% |
| Chemistry 1320 | 42.8% | 21.4% | +21.4 | 45% / 22% |
| Security Guard 0085 | 0.0% | 0.0% | 0.0 | 0% / 0% |
| General Legal And Kindred Administration 0901 | 7.7% | 1.1% | +6.6 | 8% / 1% |
| Electronics Engineering 0855 | 77.0% | 42.9% | +34.1 | 75% / 42% |
| Transportation Specialist 2101 | 58.6% | 33.9% | +24.7 | 56% / 25% |
| Medical Support Assistance 0679 | 0.0% | 0.0% | 0.0 | 0% / 0% |
| Aerospace Engineering 0861 | 79.4% | 54.5% | +24.9 | 78% / 60% |
| Telecommunications 0391 | 33.0% | 8.2% | +24.8 | 33% / 10% |
| Equal Employment Opportunity 0260 | 40.7% | 16.4% | +24.3 | 43% / 17% |
| Health Insurance Administration 0107 | 43.2% | 33.4% | +9.8 | 40% / 33% |
| Legal Assistance 0986 | 0.0% | 0.0% | 0.0 | 0% / 0% |
| Training Instruction 1712 | 19.0% | 2.8% | +16.2 | 17% / 3% |
| Archives Technician 1421 | 5.6% | 0.4% | +5.2 | 4% / 1% |
| Facility Operations Services 1640 | 17.0% | 6.1% | +10.9 | 17% / 5% |
All the comparisons, in one table
Including one more: whether higher Washington pay just covers higher prices. It doesn't fully: adjusted for local prices, the typical employee in the same jobs still earns 15% more there.
| "It's because…" | DC area | Elsewhere | Does it explain the gap? |
|---|---|---|---|
| …DC has different jobsshare at GS-14+ | 47% | 24% | No. Same jobs, share at GS-14+: still about twice as high. |
| …DC has more managersshare who supervise | 20% | 16% | A little. Slightly more supervisors, but among non-supervisors alone it's 37% vs 18% at GS-14+. |
| …people there have more experiencemedian years of service | 15.2 yrs | 14.7 yrs | No. Median years of federal service are about the same. |
| …people there have more educationbachelor's or higher | 70% | 67% | No. Bachelor's degree or higher: about the same. |
| …it's a few agencies' headquarterssame agency and job, GS-14+ | 49% | 33% | Partly. Same agency and same job, the gap shrinks, but the DC area is still higher in 147 of 171 agency-job pairs. |
| …locality pay only covers DC pricesmedian pay after local prices | $139k | $121k | No. Median pay is $151k vs $121k; after local prices, the DC area is still 15% ahead. |
GS-13+ is the share in the top three grades and GS-14+ the share in the top two. vs U.S. compares the GS-13+ share with the national 32.8%. Job-adjusted compares it with what the place's mix of jobs would predict: near zero means its grades are typical for its kinds of jobs.
States and DC
| # | State | Employees | GS-13+ | GS-14+ | vs U.S. | Job-adjusted |
|---|---|---|---|---|---|---|
| 1 | District of Columbia | 73,917 | 75.2 | 48.2 | +42.3 | +17.0 |
| 2 | Maryland | 52,457 | 63.6 | 34.3 | +30.8 | +12.6 |
| 3 | Virginia | 31,825 | 54.9 | 34.3 | +22.1 | +7.0 |
| 4 | Vermont | 1,802 | 38.4 | 15.6 | +5.6 | +3.9 |
| 5 | Colorado | 17,394 | 38.1 | 16.8 | +5.3 | −0.5 |
| 6 | Georgia | 29,498 | 36.1 | 15.6 | +3.3 | +1.6 |
| 7 | New Jersey | 6,547 | 31.4 | 13.9 | −1.4 | −1.6 |
| 8 | Washington | 14,875 | 30.2 | 11.5 | −2.6 | −2.1 |
| 9 | West Virginia | 9,986 | 28.9 | 11.9 | −3.9 | −4.7 |
| 10 | Massachusetts | 10,966 | 28.8 | 12.5 | −4.1 | −2.6 |
| 11 | Alabama | 11,786 | 28.6 | 13.3 | −4.3 | −2.4 |
| 12 | Illinois | 17,967 | 26.7 | 10.6 | −6.1 | −3.7 |
| 13 | Delaware | 1,579 | 25.9 | 11.0 | −6.9 | −0.4 |
| 14 | Ohio | 17,618 | 25.6 | 10.8 | −7.2 | −3.6 |
| 15 | Texas | 50,495 | 25.0 | 10.5 | −7.8 | −3.4 |
| 16 | Florida | 35,638 | 24.8 | 10.3 | −8.0 | −2.7 |
| 17 | North Carolina | 18,264 | 24.3 | 9.9 | −8.5 | −2.6 |
| 18 | Oregon | 10,411 | 23.5 | 8.8 | −9.4 | −5.9 |
| 19 | Rhode Island | 1,951 | 23.4 | 8.3 | −9.4 | −3.6 |
| 20 | Kansas | 6,541 | 23.3 | 8.1 | −9.5 | −6.1 |
| 21 | New Hampshire | 2,341 | 22.9 | 8.4 | −10.0 | −3.2 |
| 22 | Connecticut | 3,312 | 22.7 | 8.5 | −10.1 | −5.5 |
| 23 | California | 50,349 | 22.6 | 9.2 | −10.3 | −4.1 |
| 24 | New York | 23,803 | 22.3 | 9.0 | −10.6 | −3.9 |
| 25 | Pennsylvania | 26,298 | 22.3 | 9.2 | −10.6 | −2.4 |
| 26 | Idaho | 4,988 | 22.2 | 8.2 | −10.6 | −6.2 |
| 27 | Alaska | 3,494 | 22.0 | 7.1 | −10.9 | −8.3 |
| 28 | Louisiana | 8,144 | 21.4 | 7.4 | −11.4 | −5.4 |
| 29 | Minnesota | 9,161 | 21.3 | 7.8 | −11.5 | −4.0 |
| 30 | South Carolina | 8,745 | 20.7 | 7.0 | −12.2 | −4.5 |
| 31 | Michigan | 12,295 | 20.7 | 7.6 | −12.2 | −5.2 |
| 32 | Maine | 2,278 | 20.2 | 8.1 | −12.6 | −3.0 |
| 33 | Missouri | 18,939 | 20.1 | 7.2 | −12.7 | −3.5 |
| 34 | Hawaii | 3,139 | 19.2 | 6.8 | −13.6 | −5.2 |
| 35 | Mississippi | 6,360 | 19.1 | 7.3 | −13.7 | −4.8 |
| 36 | Iowa | 4,845 | 18.9 | 6.5 | −13.9 | −4.5 |
| 37 | Nebraska | 3,891 | 18.9 | 7.2 | −14.0 | −4.9 |
| 38 | Montana | 5,623 | 18.5 | 6.0 | −14.3 | −7.8 |
| 39 | Wisconsin | 8,903 | 18.2 | 6.0 | −14.6 | −5.0 |
| 40 | Nevada | 6,328 | 17.1 | 5.4 | −15.7 | −6.7 |
| 41 | Indiana | 7,414 | 17.1 | 5.6 | −15.7 | −5.4 |
| 42 | Oklahoma | 8,691 | 16.7 | 5.2 | −16.1 | −5.4 |
| 43 | New Mexico | 8,916 | 16.6 | 5.8 | −16.2 | −7.7 |
| 44 | Tennessee | 15,247 | 16.2 | 5.5 | −16.6 | −3.6 |
| 45 | Arizona | 15,022 | 16.0 | 5.3 | −16.8 | −6.2 |
| 46 | Kentucky | 8,729 | 16.0 | 5.0 | −16.8 | −4.8 |
| 47 | Arkansas | 6,331 | 15.4 | 4.7 | −17.4 | −5.9 |
| 48 | Utah | 11,476 | 15.1 | 6.1 | −17.7 | −3.3 |
| 49 | North Dakota | 2,285 | 15.1 | 4.9 | −17.8 | −7.7 |
| 50 | South Dakota | 4,500 | 14.7 | 4.3 | −18.2 | −8.3 |
| 51 | Wyoming | 3,461 | 14.0 | 4.0 | −18.8 | −8.6 |
The 114 largest metro areas
| # | Area | Employees | GS-13+ | GS-14+ | vs U.S. | Job-adjusted |
|---|---|---|---|---|---|---|
| 1 | Washington-Arlington-Alexandria, DC-VA-MD-WV | 127,108 | 73.4 | 46.2 | +40.6 | +15.9 |
| 2 | Huntsville, AL | 2,690 | 72.5 | 42.6 | +39.7 | +3.9 |
| 3 | Palm Bay-Melbourne-Titusville, FL | 2,848 | 65.6 | 38.5 | +32.8 | +5.7 |
| 4 | Baltimore-Columbia-Towson, MD | 17,447 | 51.8 | 22.5 | +18.9 | +7.4 |
| 5 | Denver-Aurora-Centennial, CO | 11,017 | 44.9 | 20.1 | +12.1 | +1.7 |
| 6 | Raleigh-Cary, NC | 1,876 | 43.0 | 22.2 | +10.2 | +1.4 |
| 7 | San Jose-Sunnyvale-Santa Clara, CA | 3,241 | 42.3 | 25.3 | +9.5 | +0.5 |
| 8 | Atlanta-Sandy Springs-Roswell, GA | 21,613 | 42.1 | 18.7 | +9.3 | +4.0 |
| 9 | Fort Collins-Loveland, CO | 1,904 | 40.3 | 19.1 | +7.5 | +0.7 |
| 10 | Virginia Beach-Chesapeake-Norfolk, VA-NC | 5,625 | 40.1 | 20.2 | +7.3 | −0.6 |
| 11 | Parkersburg-Vienna, WV | 1,660 | 39.5 | 12.2 | +6.7 | −9.2 |
| 12 | Houston-Pasadena-the Woodlands, TX | 11,272 | 39.0 | 19.9 | +6.2 | −3.1 |
| 13 | Portland-Vancouver-Hillsboro, OR-WA | 7,401 | 37.4 | 14.4 | +4.6 | −1.4 |
| 14 | Durham-Chapel Hill, NC | 4,278 | 36.5 | 14.9 | +3.7 | +0.4 |
| 15 | Seattle-Tacoma-Bellevue, WA | 7,066 | 31.1 | 12.6 | −1.7 | −0.7 |
| 16 | Cleveland, OH | 6,603 | 31.0 | 14.1 | −1.8 | −2.3 |
| 17 | Dallas-Fort Worth-Arlington, TX | 13,320 | 31.0 | 12.9 | −1.8 | −2.1 |
| 18 | Chicago-Naperville-Elgin, IL-IN | 13,898 | 30.3 | 12.3 | −2.6 | −2.6 |
| 19 | San Francisco-Oakland-Fremont, CA | 8,912 | 30.0 | 13.2 | −2.8 | −1.6 |
| 20 | Anchorage, AK | 1,890 | 29.8 | 10.3 | −3.0 | −4.2 |
| 21 | Boston-Cambridge-Newton, MA-NH | 9,451 | 29.1 | 13.0 | −3.7 | −2.5 |
| 22 | Minneapolis-St. Paul-Bloomington, MN-WI | 5,457 | 28.1 | 11.1 | −4.7 | −1.5 |
| 23 | New Orleans-Metairie, LA | 3,848 | 27.7 | 10.8 | −5.1 | −4.5 |
| 24 | Columbus, OH | 1,976 | 27.2 | 10.5 | −5.6 | −2.7 |
| 25 | Salt Lake City-Murray, UT | 3,015 | 27.1 | 9.8 | −5.7 | −3.1 |
| 26 | New York-Newark-Jersey City, NY-NJ | 18,679 | 26.3 | 11.6 | −6.5 | −2.4 |
| 27 | Hagerstown-Martinsburg, MD-WV | 2,161 | 26.2 | 9.9 | −6.6 | −0.4 |
| 28 | Sacramento-Roseville-Folsom, CA | 4,038 | 26.1 | 8.9 | −6.7 | −5.6 |
| 29 | Lincoln, NE | 1,047 | 26.1 | 11.6 | −6.7 | −3.1 |
| 30 | Kansas City, MO-KS | 11,423 | 26.0 | 10.4 | −6.8 | −0.8 |
| 31 | Gulfport-Biloxi, MS | 2,303 | 25.6 | 11.0 | −7.2 | −2.7 |
| 32 | Boise City, ID | 2,712 | 25.4 | 8.0 | −7.4 | −4.4 |
| 33 | Pittsburgh, PA | 5,383 | 25.4 | 11.1 | −7.5 | −2.3 |
| 34 | Richmond, VA | 3,646 | 25.1 | 10.3 | −7.7 | −2.1 |
| 35 | Colorado Springs, CO | 1,016 | 25.1 | 9.0 | −7.7 | −3.1 |
| 36 | Philadelphia-Camden-Wilmington, PA-NJ-DE-MD | 14,643 | 24.8 | 10.5 | −8.0 | −1.4 |
| 37 | Charleston-North Charleston, SC | 3,153 | 24.8 | 8.3 | −8.0 | −3.9 |
| 38 | Detroit-Warren-Dearborn, MI | 4,318 | 24.5 | 10.6 | −8.3 | −4.8 |
| 39 | Ann Arbor, MI | 2,351 | 24.3 | 8.9 | −8.5 | −4.6 |
| 40 | Los Angeles-Long Beach-Anaheim, CA | 11,048 | 24.1 | 9.3 | −8.7 | −4.4 |
| 41 | Albany-Schenectady-Troy, NY | 1,465 | 24.0 | 9.0 | −8.8 | −4.2 |
| 42 | Cincinnati, OH-KY-IN | 5,223 | 24.0 | 11.1 | −8.9 | −1.8 |
| 43 | Providence-Warwick, RI-MA | 2,188 | 23.4 | 8.1 | −9.5 | −3.4 |
| 44 | San Diego-Chula Vista-Carlsbad, CA | 4,960 | 23.3 | 8.4 | −9.5 | −3.6 |
| 45 | Oklahoma City, OK | 3,215 | 23.1 | 7.7 | −9.7 | −4.8 |
| 46 | Jacksonville, FL | 2,716 | 22.6 | 8.6 | −10.3 | −2.1 |
| 47 | Miami-Fort Lauderdale-Pompano Beach, FL | 7,203 | 22.3 | 8.9 | −10.5 | −4.9 |
| 48 | San Antonio-New Braunfels, TX | 5,124 | 22.2 | 6.8 | −10.6 | −3.1 |
| 49 | Des Moines-West Des Moines, IA | 1,470 | 21.9 | 7.2 | −10.9 | −3.9 |
| 50 | Madison, WI | 2,291 | 21.9 | 7.9 | −11.0 | −4.4 |
| 51 | Phoenix-Mesa-Chandler, AZ | 6,716 | 21.5 | 7.5 | −11.3 | −3.7 |
| 52 | Orlando-Kissimmee-Sanford, FL | 4,548 | 21.4 | 8.1 | −11.4 | −3.3 |
| 53 | Urban Honolulu, HI | 2,293 | 21.4 | 7.5 | −11.5 | −5.4 |
| 54 | Albuquerque, NM | 4,698 | 21.3 | 7.4 | −11.6 | −6.1 |
| 55 | Indianapolis-Carmel-Greenwood, IN | 3,362 | 21.2 | 7.5 | −11.6 | −4.3 |
| 56 | Tampa-St. Petersburg-Clearwater, FL | 8,926 | 20.7 | 7.1 | −12.1 | −2.5 |
| 57 | Spokane-Spokane Valley, WA | 1,406 | 20.4 | 6.3 | −12.4 | −6.6 |
| 58 | Charlotte-Concord-Gastonia, NC-SC | 3,174 | 20.3 | 9.3 | −12.5 | −3.7 |
| 59 | Milwaukee-Waukesha, WI | 3,190 | 20.2 | 6.2 | −12.6 | −3.7 |
| 60 | Sioux Falls, SD-MN | 1,100 | 20.1 | 6.3 | −12.7 | −4.2 |
| 61 | Nashville-Davidson-Murfreesboro-Franklin, TN | 5,061 | 19.9 | 6.9 | −12.9 | −2.6 |
| 62 | Austin-Round Rock-San Marcos, TX | 6,845 | 19.9 | 8.2 | −12.9 | −0.7 |
| 63 | Iowa City, IA | 1,065 | 19.6 | 4.9 | −13.2 | −6.0 |
| 64 | Tulsa, OK | 1,354 | 19.5 | 7.2 | −13.3 | −5.4 |
| 65 | Lexington-Fayette, KY | 1,862 | 19.4 | 5.3 | −13.4 | −4.7 |
| 66 | New Haven, CT | 1,582 | 19.2 | 5.7 | −13.6 | −7.6 |
| 67 | Omaha, NE-IA | 1,740 | 19.0 | 6.4 | −13.9 | −4.9 |
| 68 | Syracuse, NY | 1,199 | 18.5 | 5.9 | −14.3 | −6.0 |
| 69 | St. Louis, MO-IL | 6,008 | 18.4 | 6.4 | −14.4 | −7.7 |
| 70 | Reno, NV | 1,654 | 18.3 | 4.5 | −14.6 | −5.0 |
| 71 | Rochester, NY | 1,290 | 18.0 | 6.2 | −14.8 | −6.8 |
| 72 | Columbia, MO | 1,401 | 17.8 | 5.8 | −15.0 | −4.8 |
| 73 | Louisville/Jefferson County, KY-IN | 2,673 | 17.6 | 5.7 | −15.2 | −5.8 |
| 74 | Buffalo-Cheektowaga, NY | 2,993 | 17.5 | 5.9 | −15.3 | −5.0 |
| 75 | Columbia, SC | 2,975 | 17.2 | 4.6 | −15.6 | −5.2 |
| 76 | Beckley, WV | 1,065 | 17.2 | 5.7 | −15.6 | −6.6 |
| 77 | Las Vegas-Henderson-North Las Vegas, NV | 4,012 | 17.1 | 6.0 | −15.7 | −6.0 |
| 78 | Topeka, KS | 1,475 | 17.1 | 4.5 | −15.7 | −8.2 |
| 79 | Augusta-Richmond County, GA-SC | 2,236 | 16.9 | 5.7 | −15.9 | −5.7 |
| 80 | Little Rock-North Little Rock-Conway, AR | 3,030 | 16.5 | 4.5 | −16.3 | −6.4 |
| 81 | Wichita, KS | 1,184 | 16.0 | 3.7 | −16.9 | −4.6 |
| 82 | Rapid City, SD | 1,002 | 15.9 | 4.2 | −17.0 | −7.8 |
| 83 | Montgomery, AL | 1,344 | 15.8 | 4.7 | −17.0 | −5.8 |
| 84 | Gainesville, FL | 2,366 | 15.4 | 4.6 | −17.4 | −4.8 |
| 85 | Jackson, MS | 2,581 | 15.4 | 4.8 | −17.4 | −7.0 |
| 86 | Tuscaloosa, AL | 1,016 | 15.3 | 4.8 | −17.6 | −5.1 |
| 87 | Riverside-San Bernardino-Ontario, CA | 4,381 | 15.2 | 4.6 | −17.6 | −6.9 |
| 88 | Fayetteville-Springdale-Rogers, AR | 1,222 | 15.2 | 5.0 | −17.6 | −5.5 |
| 89 | Tucson, AZ | 3,157 | 15.1 | 4.5 | −17.7 | −6.3 |
| 90 | Asheville, NC | 2,127 | 15.1 | 4.5 | −17.7 | −4.8 |
| 91 | Dayton-Kettering-Beavercreek, OH | 1,943 | 15.1 | 4.6 | −17.7 | −5.8 |
| 92 | Birmingham, AL | 4,177 | 14.9 | 4.0 | −17.9 | −3.1 |
| 93 | Roanoke, VA | 1,703 | 14.4 | 4.2 | −18.4 | −5.5 |
| 94 | Flagstaff, AZ | 1,024 | 14.1 | 5.1 | −18.8 | −9.5 |
| 95 | Alexandria, LA | 1,117 | 14.1 | 3.2 | −18.8 | −7.3 |
| 96 | Winston-Salem, NC | 1,258 | 13.1 | 4.3 | −19.7 | −3.7 |
| 97 | Johnson City, TN | 1,646 | 12.9 | 3.0 | −19.9 | −5.1 |
| 98 | Augusta-Waterville, ME | 1,023 | 12.8 | 4.3 | −20.0 | −5.9 |
| 99 | Killeen-Temple, TX | 2,488 | 12.0 | 3.3 | −20.8 | −7.3 |
| 100 | El Paso, TX | 1,668 | 11.9 | 3.1 | −20.9 | −7.9 |
| 101 | Shreveport-Bossier City, LA | 1,215 | 11.4 | 3.0 | −21.5 | −7.1 |
| 102 | Huntington-Ashland, WV-KY-OH | 1,419 | 11.1 | 3.1 | −21.7 | −6.7 |
| 103 | Muskogee, OK | 2,009 | 11.1 | 2.4 | −21.7 | −3.9 |
| 104 | Waco, TX | 1,606 | 11.1 | 3.1 | −21.7 | −3.0 |
| 105 | Memphis, TN-MS-AR | 5,551 | 10.9 | 3.7 | −22.0 | −4.6 |
| 106 | Fayetteville, NC | 1,966 | 10.7 | 2.3 | −22.1 | −6.5 |
| 107 | St. Cloud, MN | 1,331 | 10.7 | 2.1 | −22.2 | −4.6 |
| 108 | Ogden, UT | 6,355 | 10.3 | 4.8 | −22.5 | −1.3 |
| 109 | Dublin, GA | 1,148 | 9.7 | 1.9 | −23.2 | −6.5 |
| 110 | Scranton-Wilkes-Barre, PA | 2,011 | 9.4 | 2.3 | −23.4 | −4.8 |
| 111 | Lebanon, PA | 1,482 | 9.1 | 2.0 | −23.7 | −7.4 |
| 112 | Fresno, CA | 5,193 | 6.7 | 2.1 | −26.1 | −3.5 |
| 113 | Gallup, NM | 1,293 | 5.4 | 1.4 | −27.4 | −9.4 |
| 114 | Show Low, AZ | 1,211 | 4.0 | 1.1 | −28.8 | −10.7 |
Some leaders are partial pictures. Huntsville and Palm Bay rank high on NASA's Marshall and Kennedy centers; the much larger Army workforce at Redstone Arsenal and the Space Force and Air Force civilians on the Space Coast aren't published.
What is the General Schedule (GS)?
The General Schedule is the main pay system for federal civilian employees: about two in three of them are on it. It has 15 grades, and a job's grade sets its pay range; each grade also has 10 steps for time in the job, and pay depends on location too. In 2026, GS-15 pays $147,945 to $197,200 a year.
Why are so many of America's top federal jobs in Washington?
The DC area has 17% of GS employees but 58% of GS-15s, and the gap holds within the same occupations. It isn't explained by experience, education or management roles. One likely reason: GS grades follow a position's responsibility and scope, and many positions with national responsibilities are at agency headquarters in the DC area. The data can't show how much of the gap that accounts for.
What share of GS employees are GS-13 or higher?
33% of General Schedule employees with a published duty station, as of August 2026. Among metro areas with 1,000+ GS employees it ranges from 4% in Show Low, AZ to 73% in the Washington, DC area.
Where do most GS-15s work?
58% of GS-15s work in the Washington, DC metro area (22,786 people). The next largest groups are in Baltimore, MD (1,173), Atlanta, GA (977), Houston, TX (909).
Are GS jobs graded higher in Washington, DC?
In the same occupation, usually yes: the DC area has a higher share at GS-14 or higher in 41 of 42 large occupations. HR specialists: 40% there vs 11% elsewhere. Grades follow a position's scope and impact, and headquarters positions tend to be national in scope.
Does higher DC pay just cover the cost of living?
Not entirely. In the same occupations, median pay is $151k in the DC area vs $121k elsewhere. Adjusted for local prices (BEA price levels), it's $139k vs $121k, still 15% ahead.
Which states have the most senior GS workforce?
After DC (75%), Maryland (64%) and Virginia (55%) have the highest share at GS-13 or higher; Wyoming (14%) and South Dakota (15%) the lowest.
Why are some military towns missing or low?
OPM doesn't publish the duty station of Defense employees or of some law-enforcement occupations, about 44% of GS employees. Places with large military or law-enforcement workforces are undercounted here.
- Source. OPM Federal Workforce Data, employment snapshot for August 2026 (one row per employee; file, published by OPM October 4, 2026). It's the newest complete month: OPM notes that September 2026 is missing some Defense data. We repeated everything with September 2024.
- Who's counted. Employees on the General Schedule: pay plans GS and GL (GL is law-enforcement staff on GS grades), grades 1 to 15, at a published U.S. duty station (734,583 people). Not counted: VA doctors and nurses on Title 38 pay (VN, VM...), trades and crafts (wage grade), the Senior Executive Service, and agencies with their own pay systems.
- Where. The duty station's Census metro or micro area (CBSA) and state, as OPM codes them. 4% work outside any metro or micro area, including everyone in Puerto Rico and the other territories: they count in their state and the U.S., not in an area. A metro area isn't the same as a GS locality pay area; the look-up links each area to its locality pay table. Map dots sit at the employee-weighted center of each area's counties.
- What's withheld. OPM doesn't publish the duty station of 44% of GS employees (575,210 of 1,310,782). That includes all of Defense (367,993 people) and whole occupations elsewhere, such as criminal investigators, CBP officers, Border Patrol agents, correctional officers and IRS revenue agents. Share withheld by department: Defense agencies 100%, Air Force 100%, Army 100%, Navy 100%, Homeland Security 79%, Justice 69%, Treasury 17%; every other large department under 10%. So places with big military or law-enforcement workforces are undercounted. Because whole occupations are withheld, not particular grades, comparing the same occupation across places isn't skewed by it.
- Thresholds. Metro areas are ranked and drawn on the map with 1,000+ employees. The look-up shows every place but warns below 100. An occupation in a place is shown with 20+ employees.
- Job-adjusted. For each place, we took each employee's occupation's national GS-13+ rate and averaged them: the share the place would have if its people were graded like their occupation nationwide. Job-adjusted = actual minus that.
- Employees, not job openings. These are people in jobs on one day. Job announcements (USAJOBS) are a different measure, and aren't used here.
- Reproducible. One script,
scripts/analyze-gs-geography.py, downloads the file and writes every number and CSV on this page. It checks itself before writing: grade shares add to 100, area and state totals add up, and no area is counted twice.
- Every metro area and every state and territory (CSV): employees, share in each grade band, GS-13+ and GS-14+, vs U.S., job-adjusted, largest agency. September 2024: metros, states.
- Every occupation in every metro area (CSV, 20+ employees). September 2024.
- Same occupation, DC area vs elsewhere (CSV). September 2024.
Data and images free to use, including commercially, under CC BY 4.0: credit "Paybook analysis of OPM Federal Workforce Data, August 2026" and link to this page.
Use the images anywhere, with a link back to this page. Download the map Download "Same job, different grade" Dark version
Spotted an error, or know why a place looks the way it does? Email paybook@loopi.sh. We fix mistakes promptly and list every change here with its date.
- : published, with OPM's August 2026 data and a check against September 2024.
- : rewrote the story so it explains the GS system and walks through each explanation we tested. The numbers didn't change, except one correction: we had credited Raleigh's share to EPA, whose large campus is in the Durham metro area.